Know what is running low and what to order
Record deliveries, sales, returns and stock-count corrections on one sheet. On-hand stock, stock value, margin and status update for every product, and anything at or below its reorder point lands on a Reorder List.
- NOMINAL Your data stays in your file
- READY Excel .xlsx, no macros
What it does
300 products
SKU, category, supplier, unit cost, sale price, opening stock, reorder point and reorder quantity, with calculated received, sold, on hand, stock value, margin and a status of OK, Reorder, Out of stock or Negative - check.
Movements
2,000 rows of Receive, Sale, Return or Adjustment. Pick the SKU from a drop-down; unknown SKUs and incomplete rows are flagged.
A reorder list
Items to order with supplier, on-hand, reorder point, order quantity, unit cost and total order cost.
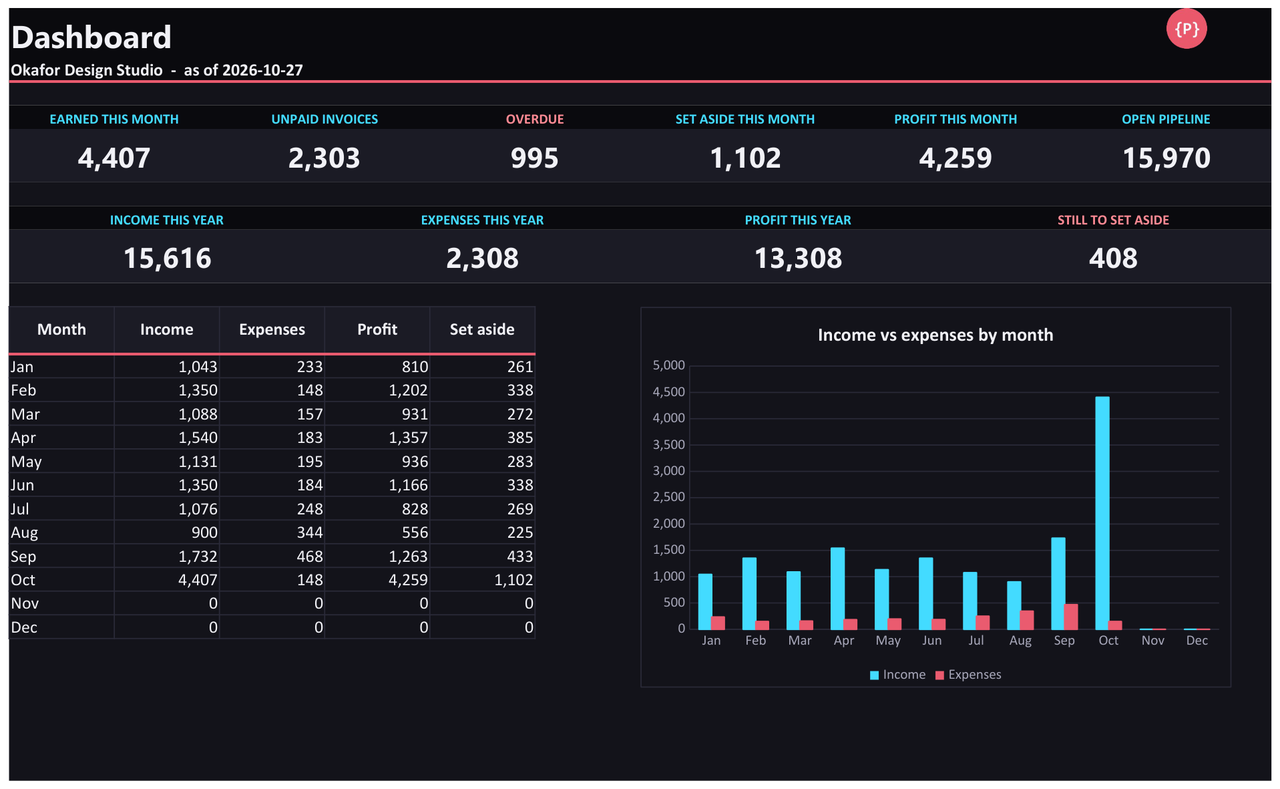
A dashboard
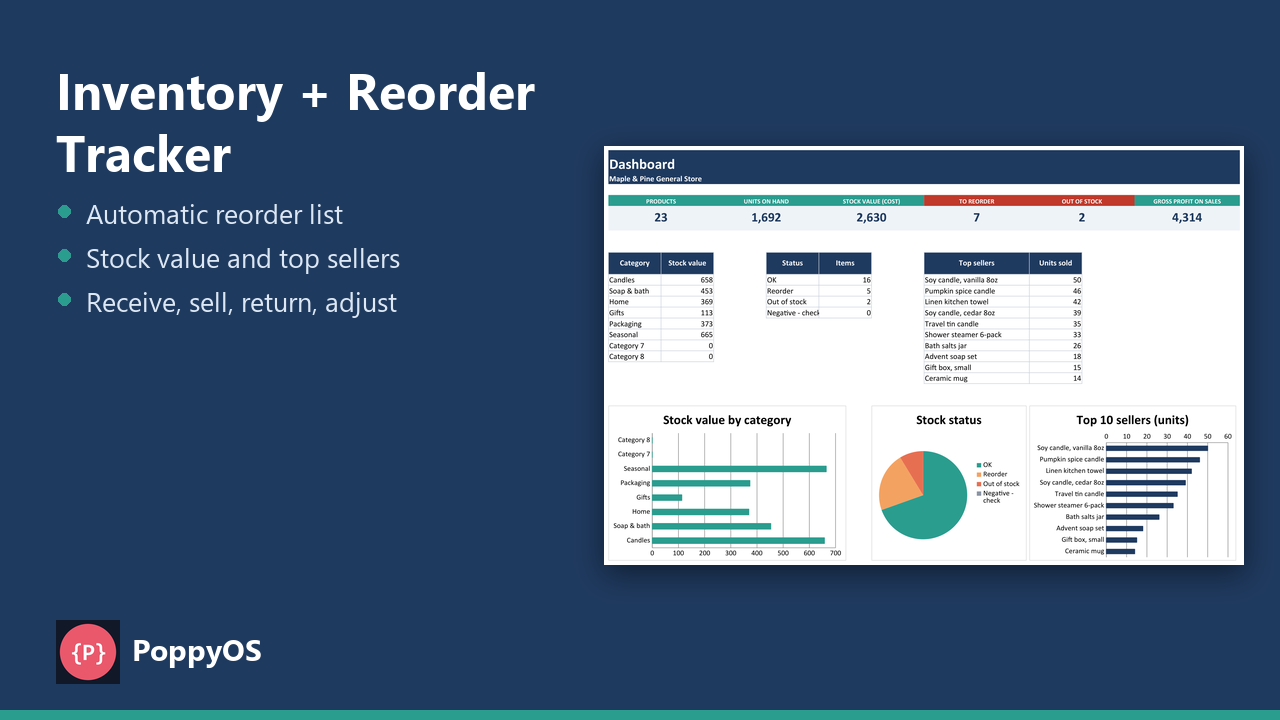
Product count, units on hand, stock value at cost, items to reorder, out-of-stock count, gross profit on sales, stock value by category, status mix and top 10 sellers.
Who it is for
- Small shops and makers who track stock in a spreadsheet.
- Sellers who want a ready list of what to order and from whom.
- People who would rather own a spreadsheet than pay a subscription.
Honest limits
- One unit cost per product. There are no FIFO or average-cost layers.
- A negative on-hand figure means a sale or adjustment was recorded without matching stock. It is flagged in red.
- It is not connected to Etsy, Shopify or any store. You enter movements yourself.
- The formulas were recalculated in LibreOffice with no error values and checked against a separate Python calculation. It has not been opened in Microsoft Excel or Google Sheets, which can import the .xlsx file; check your own copy after import.
Details
- Included: An example workbook with realistic sample data, a blank copy, a README with set-up steps and the limits.
Tested automatically against independent reference implementations. Questions? Support.